Emerging research shows that not all calories are processed in the same way. In particular, the quantity and quality of carbohydrates consumed affects insulin release, hunger, and fat storage. Glycemic index (GI) is an objective way of measuring this effect. This Whole Health tool defines glycemic index and glycemic load and explains how they can be used. Resources for gathering more information are provided below.
What is Glycemic Index?
The glycemic index of a food refers to the effect the food has on the bodys blood sugar levels. Blood sugar levels are raised after a person eats foods containing carbohydrates (sugars and starches). Various carbohydrate-containing foods affect blood sugar levels differently. This is a function of the type and quantity of carbohydrate, as well as the method of preparation and the presence of other substances in the food, such as soluble fiber, fat, and protein. For example, your body absorbs glucose from whole fruit differently from extracted fruit juice due to the fiber content.
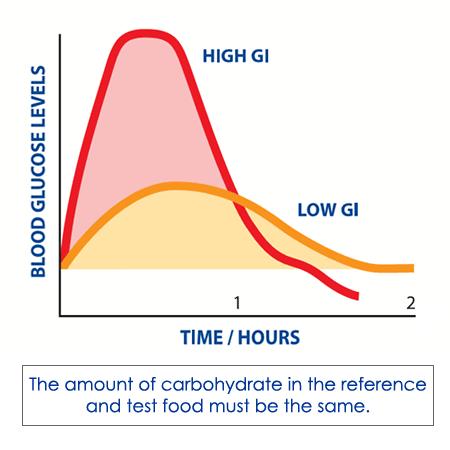
The glycemic index compares the rise in blood sugar level after eating a particular food to a reference food, often glucose. Glucose has a GI of 100. The GI of fructose is 25 and sucrose, which is a blend of the previous two, has a GI of 65. Most natural sweeteners are a combination of these three carbohydrates. Figure 1 shows the difference between a low GI and a high GI food in terms of effects on blood glucose levels over time.

What is Glycemic Load?
The glycemic load (GL) is a more accurate tool for assessing the impact of eating carbohydrates. It gives a more complete picture than does glycemic index alone, because it accounts for the amount of carbohydrate in a serving. A GI value indicates only how rapidly a particular carbohydrate turns into sugar, whereas GL accounts for how much of that carbohydrate a person would typically eat. The carbohydrate in watermelon, for example, has a high GI. However, there is not a lot of sugar in a serving of watermelon, since most of it is fiber and water. Thus watermelon’s glycemic load is relatively low.
Foods that have a low GL almost always have a low GI. In contrast, foods with an intermediate or high GL can have a GI that ranges from very low to very high.
Why Are These Numbers Important?
A low glycemic index diet has been associated with improvements in:
- Obesity[1][2][3]
- Type 2 Diabetes[3][4][5][6]
- Gestational Diabetes[7]
- Metabolic Syndrome[8]
- PCOS[9]
- NAFLD[10]
- Dyslipidemia[11]
- Hypoglycemia[4]
Conversely, diets with high glycemic index or glycemic load are strongly associated with type 2 diabetes incidence.[12] Dietary glycemic index is also positively associated with the prevalence of metabolic syndrome, though according to one review, a significant association between dietary glycemic load and metabolic syndrome has not yet been found.[13]
Examples of GIs for common foods are listed in Table 1.
Table 1. Average Glycemic Index of Common Foods [14]
| Food Item | Glycemic Index |
|---|---|
| White Bread | 75 |
| Corn Tortilla | 46 |
| Bagel | 72 |
| Baked Potato | 85 |
| Wheat Bread | 74 |
| White Rice | 87 |
| Pasta | 49 |
| Sweet Potato | 54 |
| Barley | 25 |
| Brown Rice | 55 |
| Oatmeal | 61 |
| Couscous | 65 |
| Cow's Milk | 37 |
| Soy Milk | 34 |
| Rice Milk | 86 |
| Yogurt | 41 |
| Food Item | Glycemic Index |
|---|---|
| Pineapple | 66 |
| Orange | 43 |
| Mango | 51 |
| Pear | 33 |
| Apple | 36 |
| Banana | 51 |
| Watermelon | 76 |
| Grapes | 46 |
| Carrots | 39 |
| Corn | 52 |
| Peas | 51 |
| Most Vegetables | < 20 |
| Chickpeas | 28 |
| Kidney Beans | 24 |
| Black Beans | 30 |
| Peanuts | 7 |


